Finding & Fixing Upstream Impairments
Trilithic has been in the business of return path monitoring and sweep for decades and things have changed dramatically over that time. In the beginning MSOs needed the upstream for simple low-bandwidth services such as program guides and video on demand and there was plenty of bandwidth to go around for everyone. At this time most MSOs dealt with upstream ingress and spurious noise by simply adjusting their upstream carriers to step around known sources of ingress such as amateur radio and broadcast TV stations. Over time, MSOs have needed to increase their bandwidth to satisfy customer demand. However, the MSOs can only add more bandwidth by adding more upstream channels. But, before they can add more upstream channels most MSOs have found that they must first reclaim their upstream for these new upstream channels.
Up until recently the only way to isolate upstream issues was by performing return path monitoring and sweeping from the headend. This was an expensive proposition to install and maintain racks of monitoring equipment that could only see what was happening back at the headend. Using headend monitoring, MSOs could isolate issues to a specific node in the headend and then a technician would be dispatched to the node to track down the issue that was causing the upstream impairment. This method could prove to be a tedious effort for the technician because early field analyzers weren’t fast enough to capture isolated events and spurious ingress with nothing more than a spectrum analyzer that was never designed to find these kinds of issues.
These divide-and-conquer methods to upstream troubleshooting proved to be very time consuming and frustrating to technicians and resulted in multiple truck rolls to fix all of the impairments that compounded into what was being identified in the headend. In addition, due to the cost and complexity of return monitoring and sweep efforts MSOs have increasingly been trying to find a way to monitor the upstream with less equipment in the headend. As a result, some MSOs have implemented efforts to perform Proactive Network Maintenance (PNM) on their systems using their cable modems in the field as test probes and their CMTS in the headend as a central monitoring point for their upstream. Using the features built into their DOCSIS 3.0 and DOCSIS 3.1 CMTSs and cable modems, MSOs are finding the results from these efforts provide an invaluable insight into the overall health of their cable plant.
In response to the popularity of the new tools MSOs were using in their headend, field technicians were begging for similar tools to make their jobs easier in the field when trying to isolate these issues. In turn, MSOs turned to companies like Trilithic to develop new and unique ways to leverage some of the same tests in the filed using their technician’s field analyzers.
One-of-a-Kind Upstream Troubleshooting
With installation, service and maintenance technicians in mind Trilithic has developed a one-of-a-kind upstream troubleshooting test suite for our New DSP family of field analyzers that includes three easy-to-use and powerful upstream troubleshooting tools.
- Upstream Linear Distortions – This measurement feature provides technicians with the same types of tests that they have become familiar with in their Proactive Network Maintenance (PNM) systems to determine if equalization is hiding potential problems within the upstream. This feature includes three individual tests which include; pre-equalizer taps with distance to fault, in-channel response, and group delay. When combined, these features prove to be an effective tool for identifying and pinpointing the location of defects within your hardline system, drop system, and the wiring or hardware in your customer’s homes that can act as sources for upstream impairments.
- Upstream TraffiControl Plus – This measurement feature gives field technicians a real time view within active channels of the return band to troubleshoot upstream ingress and noise problems. With this feature technicians in the field can see the ingress that is present underneath an upstream cable modem channel and how it as affecting your signal-to-noise ratios while providing them with measurement tools that are similar to what they would see on their CMTSs in the headend. This high speed spectral analysis of your upstream will show both your modem carrier activity and any spurious signals or ingress that is present underneath your carriers. In addition to this high speed spectral analysis, a waterfall diagram provides technicians with the ability to see the distribution of spectral power within the upstream to determine if the ingress our noise that they are monitoring occurs frequently, infrequently, or somewhere in between.
- Cable Modem Sweep – Trilithic has moved the bar one step higher with our powerful new patent pending CM Sweep measurement feature that uses the upstream carriers of our built-in DOCSIS 3.0 and DOCSIS 3.1 modems to perform in-band return sweep without the need for any sweep gear in the headend. When pre-equalization is enables on your CMTS in the headend, this feature gives field technicians the ability to sweep inside their upstream modem channels which proves useful in identifying any potential gain and tilt issues that may otherwise be hidden by cable modem pre-equalization.
The Upstream Linear Distortion feature takes advantage of the pre-equalization function built in to modern DOCSIS 3.0 and DOCSIS 3.1 CMTSs. The main objective for pre-equalization is to improve upstream performance in the presence of certain RF impairments related to in-channel frequency response, micro-reflections, and group delay. The CMTS looks at messages coming from the cable modem and evaluates the signal quality of the messages. If the CMTS determines that the messages can be improved by pre-equalization, the CMTS sends equalizer adjustment values to the cable modem. The cable modem then applies these equalizer adjustment values, called coefficients, to its pre-equalizer.
As a result of these adjustment values, the cable modem transmits a pre-distorted signal to compensate for impairments between the cable modem and the CMTS. As this pre-distorted signal traverses the HFC network, it will experience the effects of RF impairments. By the time the pre-distorted signal from the cable modem arrives at the CMTS, it will no longer have any of the original pre-distortion, as the RF impairments will have transformed it back into a near-ideal signal that the CMTS intended to see.
These signals are illustrated with time delay equalizer taps and can be evaluated for distance to fault. Upstream linear distortion analysis takes the EQ taps from the cable modem and displays their values along with the in-channel response and group delay graphs that are calculated from these values.
Pre-Equalizer Taps
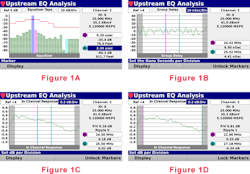
In Figure 1A, the blue tap (position 8) is representative of the main modem tap with a horizontal red line that indicates the allowable correction threshold which is defined in the DOCSIS specification. If any of the green pre-main or post-main taps exceed the allowable correction threshold, it indicates that there is a likely an issue or impairment in the return path.
- If any of the pre-main taps in positions 1–7 exceed the allowable correction threshold it often indicates the presence of impairments causing group delay issues.
- If any of the post-main taps in positions 9–24 exceed the allowable correction threshold it often indicates the presence of impairments causing in channel response issues.
Technicians also have the ability to quickly and easily obtain a rough distance to the fault by using adjustable markers to select specific taps which are showing signs of impairment.
Group Delay
In Figure 1B, the Group Delay of a typical upstream channel is displayed to show the difference in transmission time across the channel as measured in 1 MHz increments which are defined in the DOCSIS specification. Technicians can use the adjustable markers to help identify the frequencies where the group delay is experiencing high levels of time delay (> 200 ns/MHz) which is indicated by the ripple measurement. Moving each marker to the edges of the channel will also provide technicians with an indication of what the peak to valley value is across the full width of the channel.
In Channel Response
In Figure 1C, the In Channel Response of a typical upstream channel is displayed to show the amplitude flatness of the channel as measured in 1 MHz increments which are defined in the DOCSIS specification. Technicians can use the adjustable markers to help identify the frequencies where the in channel response is experiencing high levels of micro-reflections (> 2 dB/MHz) which is indicated by the peak to valley measurements. As shown in Figure 1D, moving each marker to the edges of the channel will also provide technicians with an indication of what the peak to valley value is across the full width of the channel.
The Traffic Control Plus feature provides a real time view of the return band for 100% coverage so technicians can see even the shortest cable modem bursts and ingress even under the busiest upstream. While the downstream typically contains signals that are transmitting from the MSO to the customer the return band is for cable modem signals transmitted from the customer back to the MSO. While the signals in the forward band are constant and easy to detect, the signals in the return tend to be bursty. When attempting to use a standard spectrum analyzer to measure the return band, this bursty nature of upstream signals can cause problems because bursty upstream traffic can be as short as 6.25 microseconds. If there is enough upstream traffic, standard return spectrum analysis may catch a full channel or it may only catch a single slice of the channel. This makes it very difficult to differentiate traffic signals, noise, and ingress under the traffic when using a standard return spectrum analyzer.
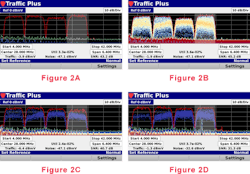
As you can see in Figure 2A, the Upstream TraffiControl Plus feature displays the maximum peak (red), maximum constant (green), and average constant (blue) signals that are present in the upstream. Typically the maximum peak signal shows an outline of the upstream carriers while the maximum constant signal shows the noise floor for a bursty signal or some sort of continuous signal and the average constant signal shows the noise floor, ingress under the carrier and other unwanted signals.
Along with the previously described traces, the Traffic Control Plus feature also displays a waterfall graph that uses color to represent the prevalence of a signal and shows the distribution of spectral power which can help technicians find signals hiding beneath the traffic. In the example shown in Figure 2B, the colors have been set to a blue, yellow, and red pattern where the blue section represents the area of the spectrum that the signal was most prevalent, the red indicates the least prevalent signals and the yellow section are signals that were in the middle.
The prevalence of the signals can be easily adjusted by the technicians to give them a better visual indication as to whether events are occurring frequently, infrequently, or somewhere in between. This normalization value is adjustable from 0.01% to 100% and in Figure 2C normalization is set to 10%. In this case the blue section shows the most prevalent signal power that was present at least 10% of the time which was an infrequent presence of modem traffic within the maximum peak envelope of the upstream carriers. Additionally, Figure 2D shows what a technician might see when there is ingress under a carrier which has been highlighted as an area of interest using adjustable markers. You can begin to understand the affect that this noise is having on the upstream carrier when you compare the signal-to-noise measurements from Figures 2C and 2D. The noise that is present under the upstream channel in Figure 2D has severely impacted the signal-to-noise ratio which would have a negative impact on the quality of service for this channel when compared to the signal without noise shown in Figure 2C.
In the past operators have always relied on out-of-band sweep carriers injected within their upstream for sweeping the return band. Until now performing in-band sweep would require injecting sweep carriers into the channels where your modems are present but that would incapacitate any active modems trying to reach the headend. As upstream bandwidth continues to fill, operators are now reducing the number of upstream sweep carriers which severely affects the resolution of their return sweep frequency response.
So, how does the operator properly sweep the upstream especially if there is no room to insert their sweep carriers? Trilithic’s answer to this question is our Cable Modem (CM) Sweep with Modem Quality of Service (MQS) measurements designed so technicians can quickly and easily assess the quality of your upstream channels. The CM Sweep feature allows the cable modem to launch bonded upstream carriers back to the CMTS for use as in-band sweep points. This gives the operator the ability to finally sweep inside their upstream modem channels and look for potential gain and tilt issues that otherwise may be hiding.
In short, this style of sweep transmission also looks at a new metric called, Modem Quality of Service (MQS) which allows the operator to see the quality of both each individual upstream channel and all upstream carriers. The higher that the MQS score is indicates that the equalizer is working harder due to upstream impairments in the path of the cable modem. A value of less than 1 dB for your MQS score is considered excellent while more severe impairments could lead to scores as high as 6 dB.
Figure 3A shows an example of a raw CM sweep trace that allows the operator to identify impairments before the reference measurement has been applied. By using CM Sweep in this manner, it allows technicians to see the modem transmit levels across the upstream bandwidth. But, more importantly this gives technicians the ability to see potential impairments within the upstream before a reference measurement is applied. This allows technicians to fix these impairments and then save a reference at the node. The technician can then bring up this reference for comparison to any point in the system such as the next active amplifier.
Figure 3B shows an example of the CM Sweep trace once a reference is applied which provides technicians with the ability to see the gain and tilt across the band based on the marker settings. Using a reference also allows the user to see their individual channel MQS scores and the overall MQS score of all of the cable modem channels in the upstream. At a quick glance, the technician is able to see the overall health of the upstream channels, which tell the operator how all the upstream channels are performing, so decisions can be made to either save the reference and move on, or look deeper into the individual carriers.
Trilithic has been in the business of return path monitoring and sweep for decades and things have changed dramatically over that time. In the beginning MSOs needed the upstream for simple low-bandwidth services such as program guides and video on demand and there was plenty of bandwidth to go around for everyone. At this time most MSOs dealt with upstream ingress and spurious noise by simply adjusting their upstream carriers to step around known sources of ingress such as amateur radio and broadcast TV stations. Over time, MSOs have needed to increase their bandwidth to satisfy customer demand. However, the MSOs can only add more bandwidth by adding more upstream channels. But, before they can add more upstream channels most MSOs have found that they must first reclaim their upstream for these new upstream channels.
About Trilithic
Product innovation at Trilithic has always been characterized by one thing: it's practical, it makes life easier for customers and it's the natural result of listening to them. That philosophy has been the driving force behind the company's growth from its beginnings as a two-man engineering team in 1986 to its current position as a global manufacturer with more than 130 employees.
As new communications applications continue to emerge, part of Trilithic's business has evolved into managing change—helping customers respond quickly to market opportunities with innovative technology and individualized solutions. But the core value of Trilithic's business approach—listening to customers—hasn’t changed. Keeping that focus intact will help provide better products in the long run and ensure continued growth for decades to come.
Trilithic provides test, measurement and monitoring solutions to HFC service providers around the world and is best known for its innovative signal level meters, leakage detection equipment and forward/return path monitoring hardware. Additionally, Trilithic is a leading supplier of homeland security government-mandated emergency alert systems for broadcast, HFC and IPTV service providers.
To learn more about the solutions offered by Trilithic, visit us at our website http://www.trilithic.com


